Energy AfterlivesMain MenuIntroductionAboutCoalOilNuclearTextual AfterlivesMusical AfterlivesPlanned and unplanned musical responses to coal, oil, nuclearPhysicalizations and VisualizationsLinks to all our project pagesInterviewsA collection of interviews with writers conducted by Energy Afterlives students.Feedback
EnergySourceComparisonChart
1media/Chart_thumb.PNG2023-12-22T15:27:17+00:00Aidan York93781657174eab44f21b0580496f4849573ba12411Chart containing data about coal, oil, and nuclear energy, for use in the board game.plain2023-12-22T15:27:17+00:00Aidan York93781657174eab44f21b0580496f4849573ba124
This page is referenced by:
1media/BoardGame.jpg2023-12-22T15:16:12+00:00Rolling the Die to Compare Energy Sources8Examine how coal, oil, and nuclear energy stack up via a race!image_header2023-12-22T16:03:22+00:00
By Aidan York '24
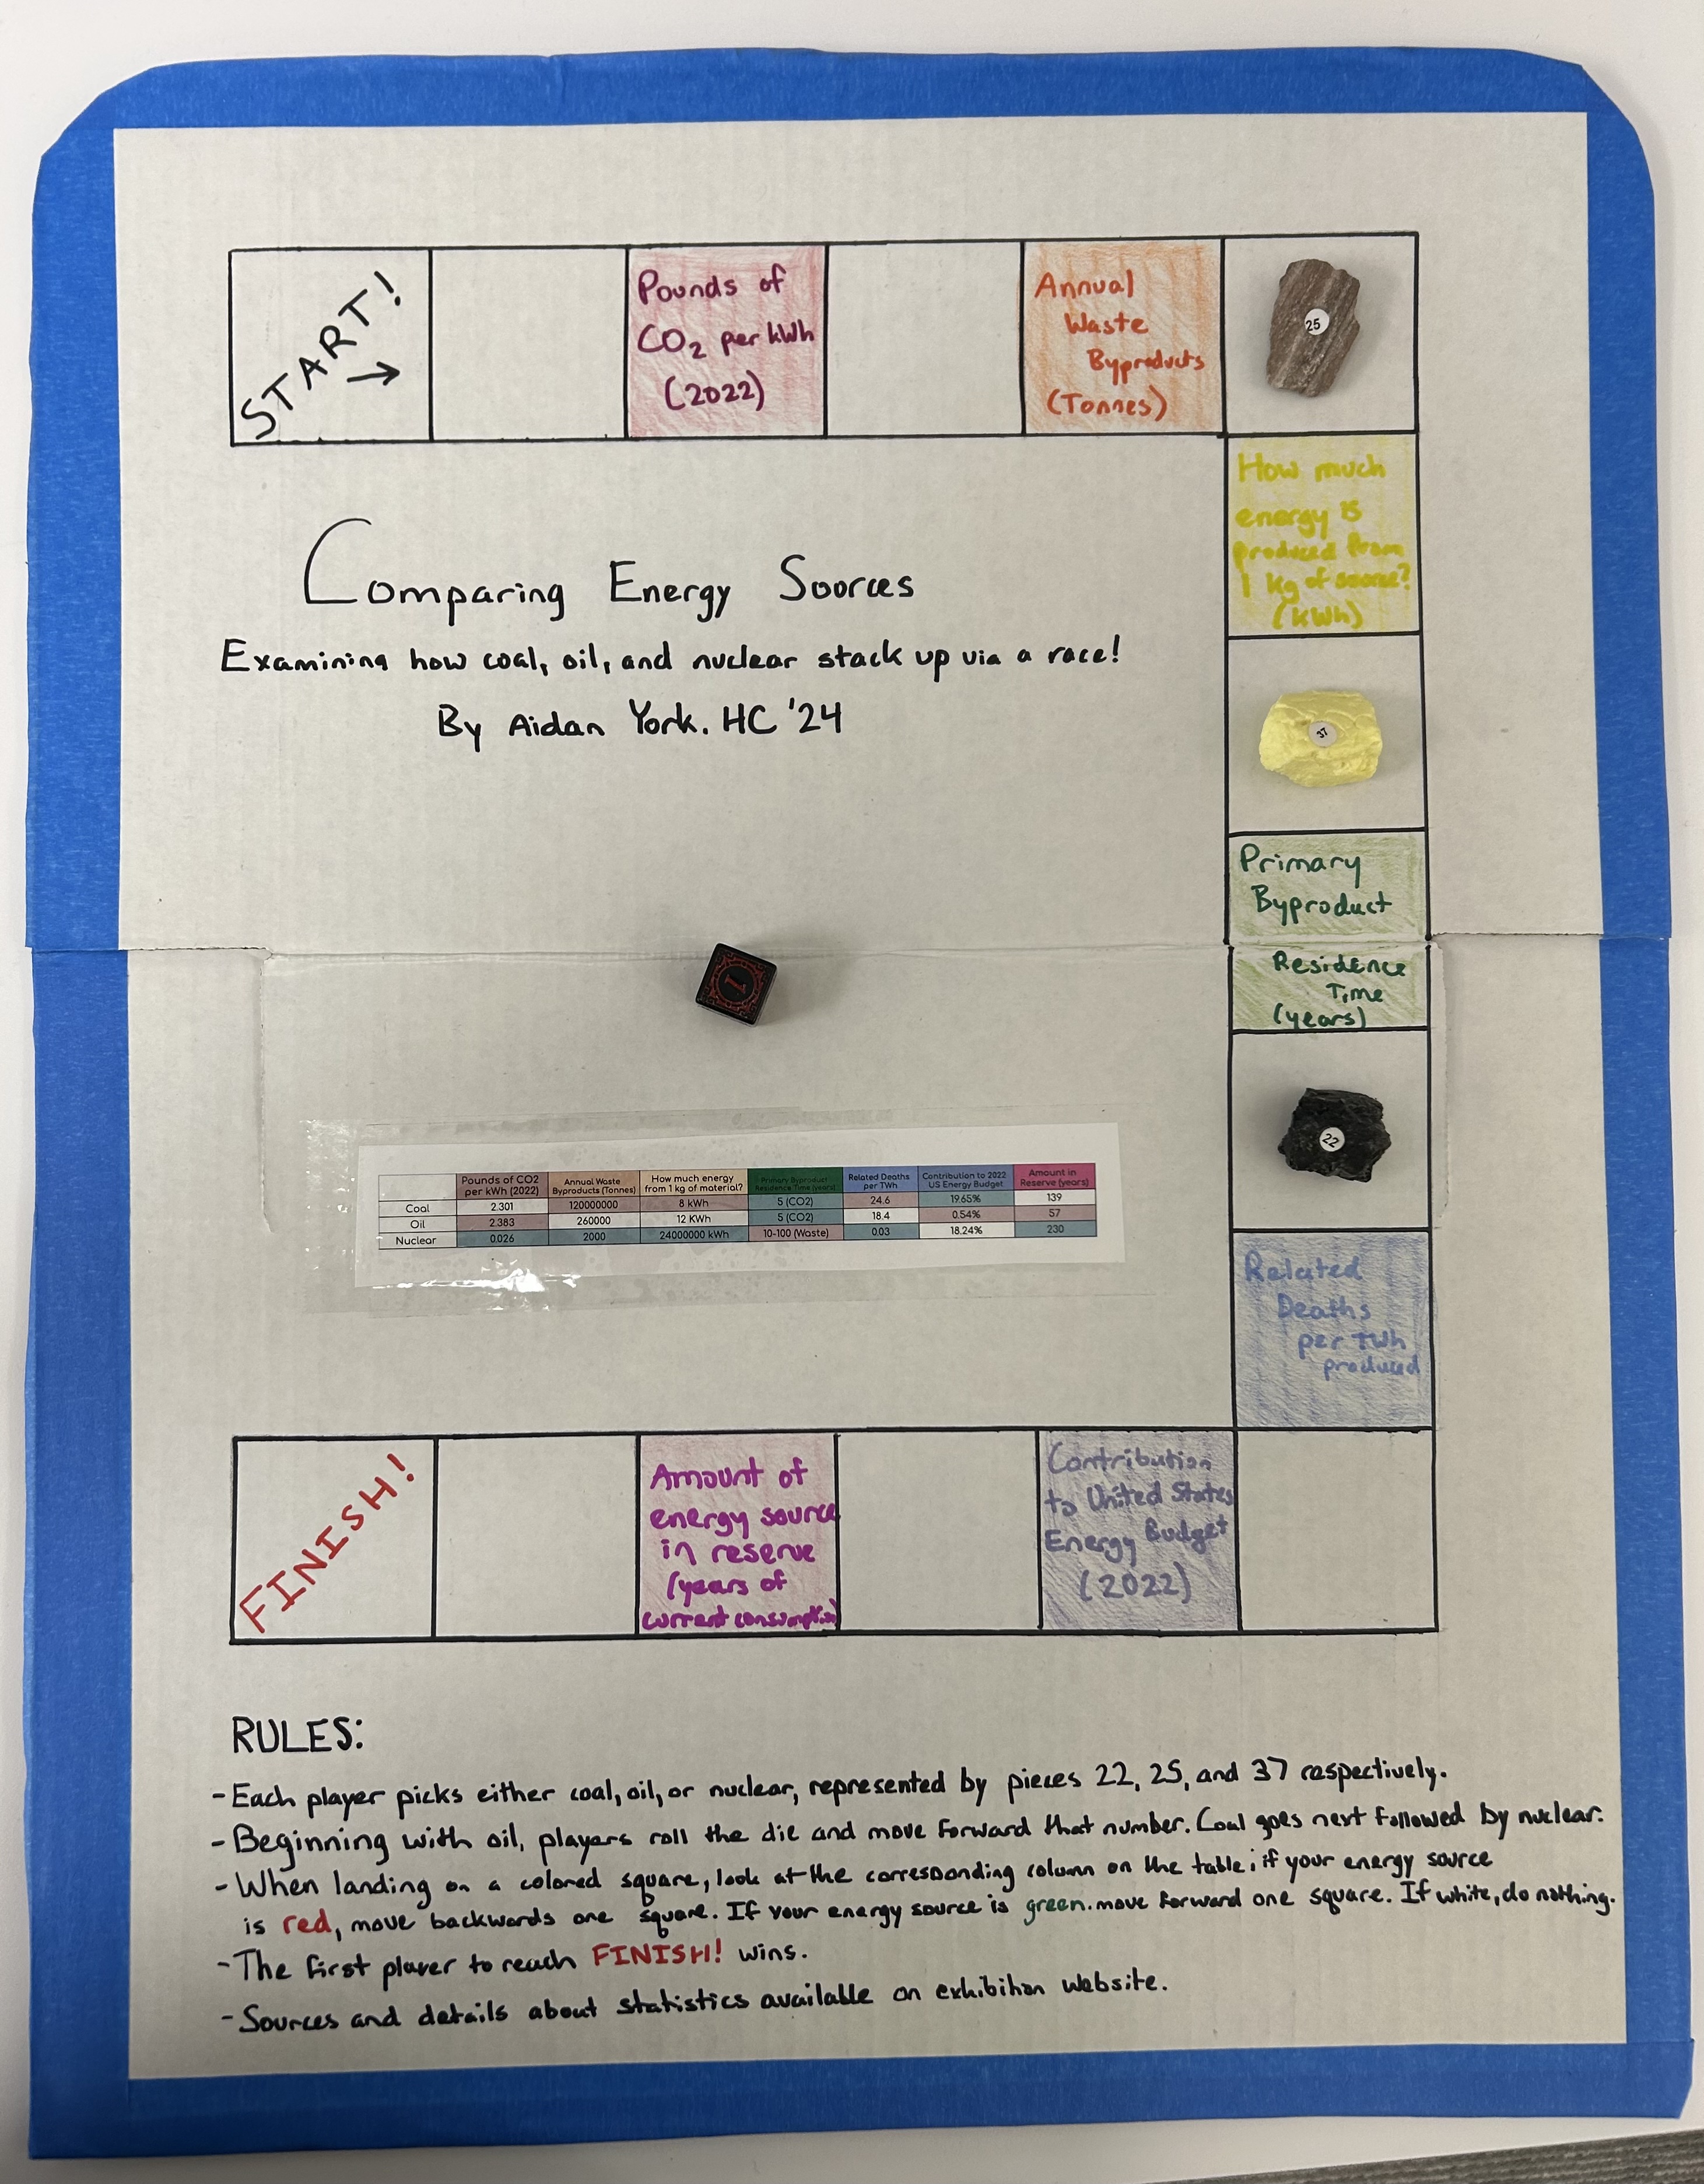
For my final project for GEO107, I wanted to present data in a way that would be easy to engage with while also being memorable. This led me to conceptualize an interactive presentation... How could people feel interested in numerical facts about coal, oil, and nuclear energy? By having them move through those stats in a board game format, of course! Thus, the genesis for the simple "Comparing Energy Sources" board game was born.
Data Compilation and Design
The first step to creating a data-based game was finding and selecting data. I picked seven questions that people might have about each energy source, and found answers to them. For some, the data was easily accessible, while others involved connecting data from across multiple sheets with calculations to obtain values. The seven facts about each energy source are:
1. Pounds of CO2 per kWh (2022) 2. Annual Waste Byproudcts (Tonnes) 3. How much energy is produced from 1 kg of source? (kWh) 4. Primary Byproduct Residence Time (years) 5. Related Deaths per TWh produced 6. Contribution to United States' Energy Budget (2022) 7. Amount of energy source in reserve (years of current consumption)
For each energy question, the "best" energy source's value (lowest for CO2 emissions, highest for contribution to US energy budget) was highlighted in green, while the "worst" was highlighted in red. Tied values were given the same color. The data table, as included in the game, is depicted below.
Gameplay Rules
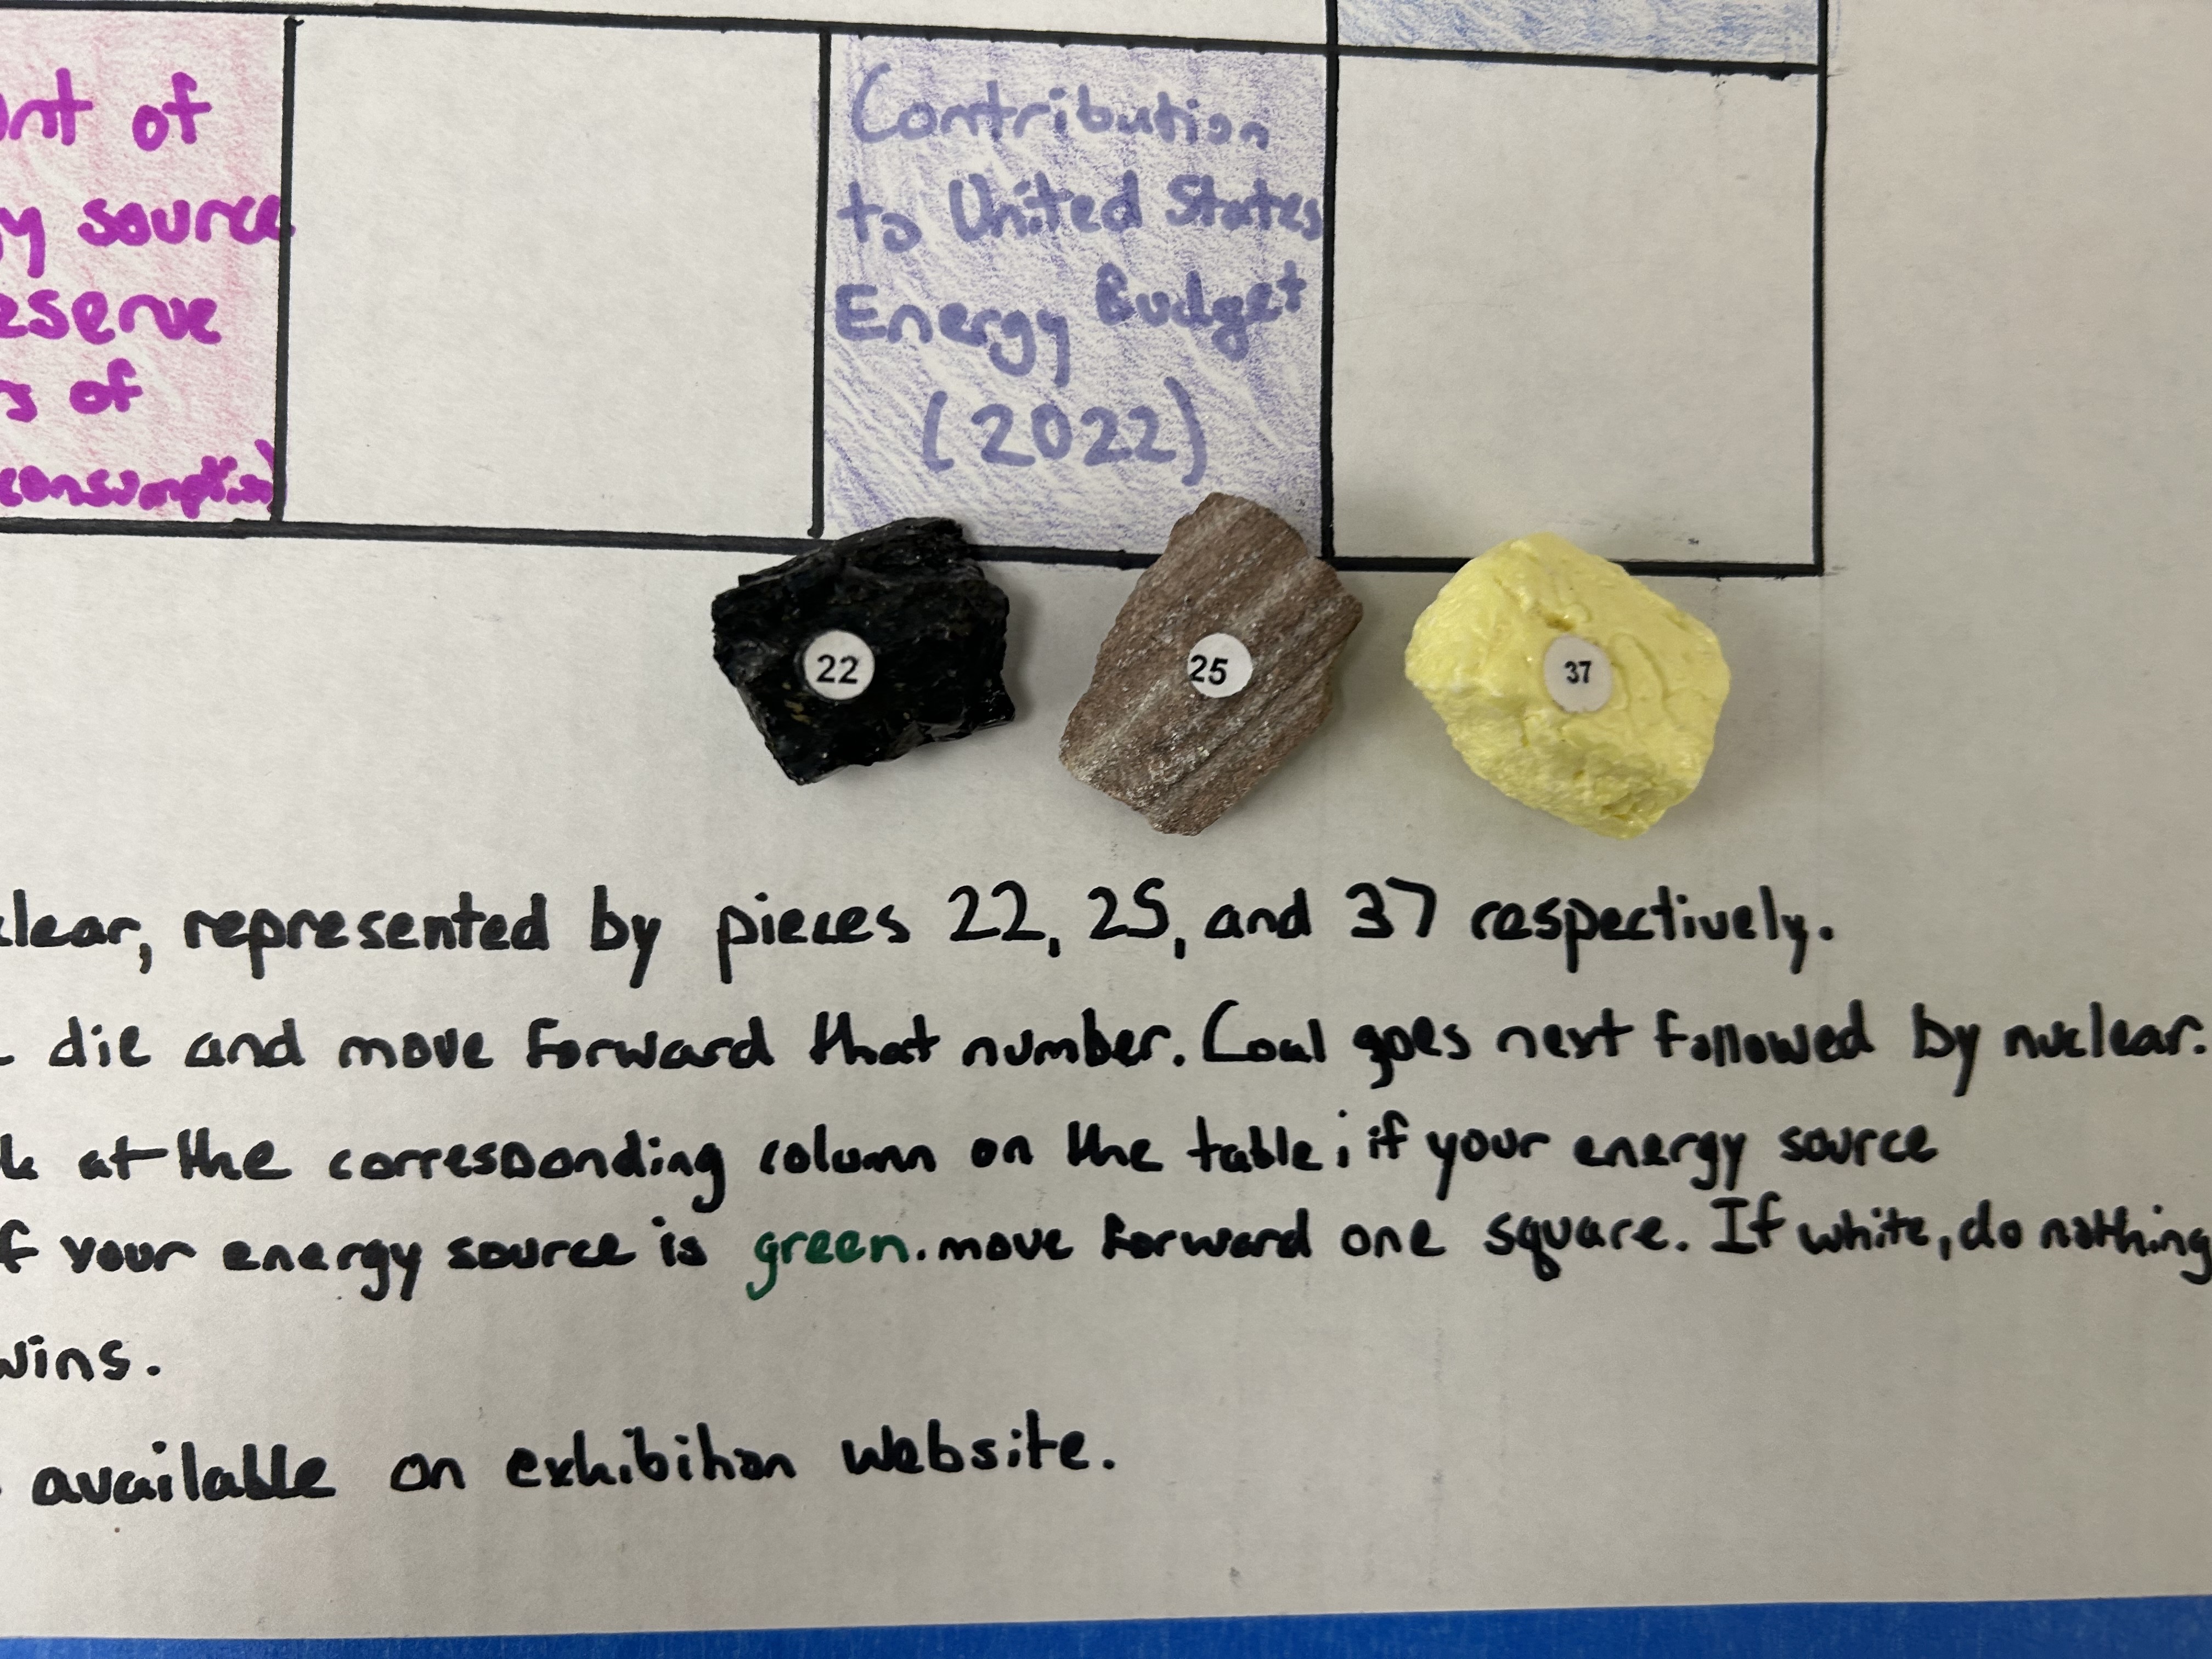
Each player picks either coal, oil, or nuclear energy, which are represented by small pieces of anthracite, sandstone, and sulfur respectively (sulfur was chosen due to its bright yellow color, not due to any scientific significance). They are depicted below.
Beginning with oil, each player rolls a six-sided die, and moves forward that number.
Should a player land on a colored square, they should examine the corresponding colored column on the data chart (below). If their energy source is green, they can move forward one space. If their energy source is red, they must move back one space. A white space means no movement in either direction.
Oil moves first, followed by coal, then nuclear energy, due to the difference in number of green values for each energy source.
The first player to reach FINISH! wins!
By presenting data in an interactive way, the game invites its players to look and analyze the data themselves. Players visually compare values between the three energy sources, and can form their own conclusion about each one, regardless of who wins the actual board game.
Board Design
The board was designed to place a blank space between each colored data space, with the FINISH! space being 16 away from the start. With some lucky rolls and good data luck, the game may be over rather quickly.